Python source code: plot_bias_variance_examples.py
import pylab as pl
from matplotlib import ticker
from matplotlib.patches import FancyArrow
np.random.seed(42)
def test_func(x, err=0.5):
return np.random.normal(10 - 1. / (x + 0.1), err)
def compute_error(x, y, p):
yfit = np.polyval(p, x)
return np.sqrt(np.mean((y - yfit) ** 2))
#------------------------------------------------------------
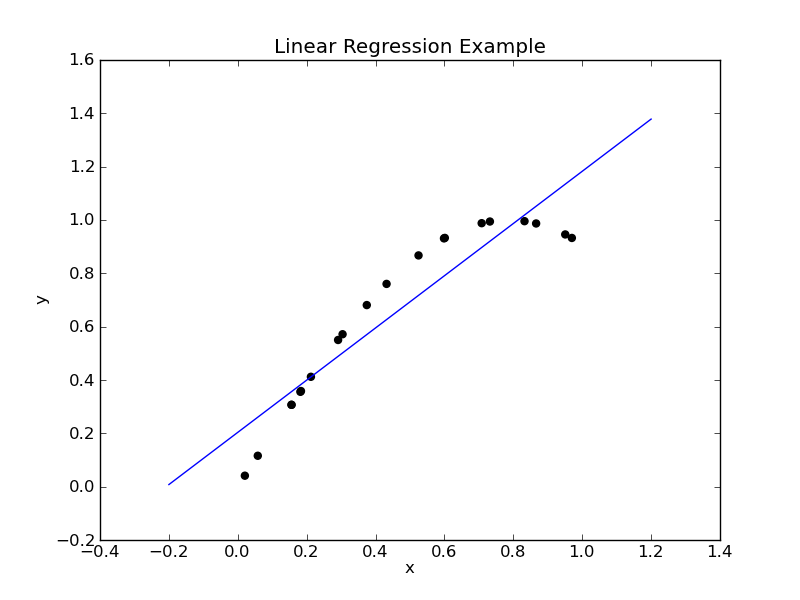
# Plot linear regression example
np.random.seed(42)
x = np.random.random(20)
y = np.sin(2 * x)
p = np.polyfit(x, y, 1) # fit a 1st-degree polynomial to the data
xfit = np.linspace(-0.2, 1.2, 10)
yfit = np.polyval(p, xfit)
pl.scatter(x, y, c='k')
pl.plot(xfit, yfit)
pl.xlabel('x')
pl.ylabel('y')
pl.title('Linear Regression Example')
#------------------------------------------------------------
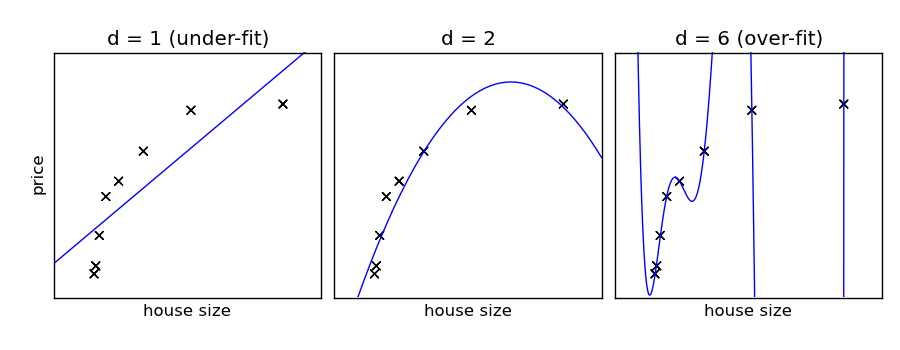
# Plot example of over-fitting and under-fitting
N = 8
np.random.seed(42)
x = 10 ** np.linspace(-2, 0, N)
y = test_func(x)
xfit = np.linspace(-0.2, 1.2, 1000)
titles = ['d = 1 (under-fit)', 'd = 2', 'd = 6 (over-fit)']
degrees = [1, 2, 6]
pl.figure(figsize = (9, 3.5))
for i, d in enumerate(degrees):
pl.subplot(131 + i, xticks=[], yticks=[])
pl.scatter(x, y, marker='x', c='k', s=50)
p = np.polyfit(x, y, d)
yfit = np.polyval(p, xfit)
pl.plot(xfit, yfit, '-b')
pl.xlim(-0.2, 1.2)
pl.ylim(0, 12)
pl.xlabel('house size')
if i == 0:
pl.ylabel('price')
pl.title(titles[i])
pl.subplots_adjust(left = 0.06, right=0.98,
bottom=0.15, top=0.85,
wspace=0.05)
#------------------------------------------------------------
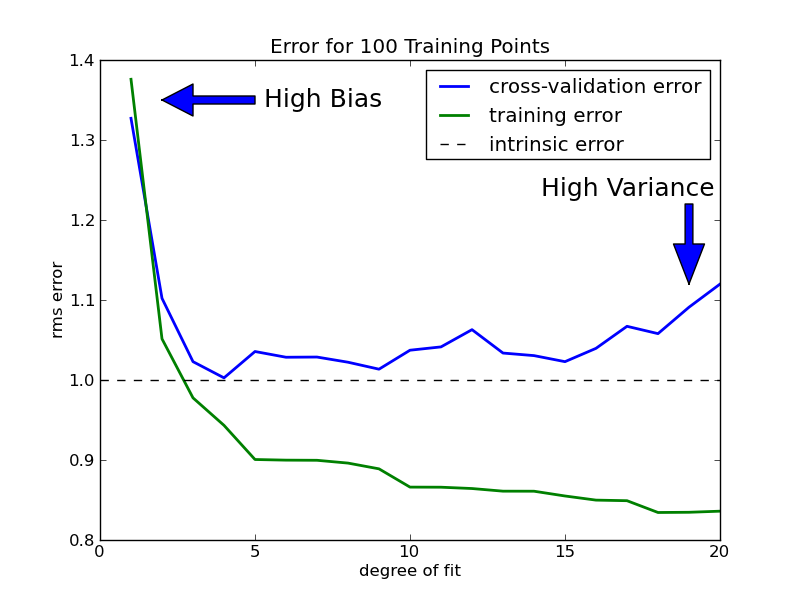
# Plot training error and cross-val error
# as a function of polynomial degree
Ntrain = 100
Ncrossval = 100
error = 1.0
np.random.seed(0)
x = np.random.random(Ntrain + Ncrossval)
y = test_func(x, error)
xtrain = x[:Ntrain]
ytrain = y[:Ntrain]
xcrossval = x[Ntrain:]
ycrossval = y[Ntrain:]
degrees = np.arange(1, 21)
train_err = np.zeros(len(degrees))
crossval_err = np.zeros(len(degrees))
for i, d in enumerate(degrees):
p = np.polyfit(xtrain, ytrain, d)
train_err[i] = compute_error(xtrain, ytrain, p)
crossval_err[i] = compute_error(xcrossval, ycrossval, p)
pl.figure()
pl.title('Error for 100 Training Points')
pl.plot(degrees, crossval_err, lw=2, label = 'cross-validation error')
pl.plot(degrees, train_err, lw=2, label = 'training error')
pl.plot([0, 20], [error, error], '--k', label='intrinsic error')
pl.legend()
pl.xlabel('degree of fit')
pl.ylabel('rms error')
pl.gca().add_patch(FancyArrow(5, 1.35, -3, 0, width = 0.01,
head_width=0.04, head_length=1.0,
length_includes_head=True))
pl.text(5.3, 1.35, "High Bias", fontsize=18, va='center')
pl.gca().add_patch(FancyArrow(19, 1.22, 0, -0.1, width = 0.25,
head_width=1.0, head_length=0.05,
length_includes_head=True))
pl.text(19.8, 1.23, "High Variance", ha='right', fontsize=18)
#------------------------------------------------------------
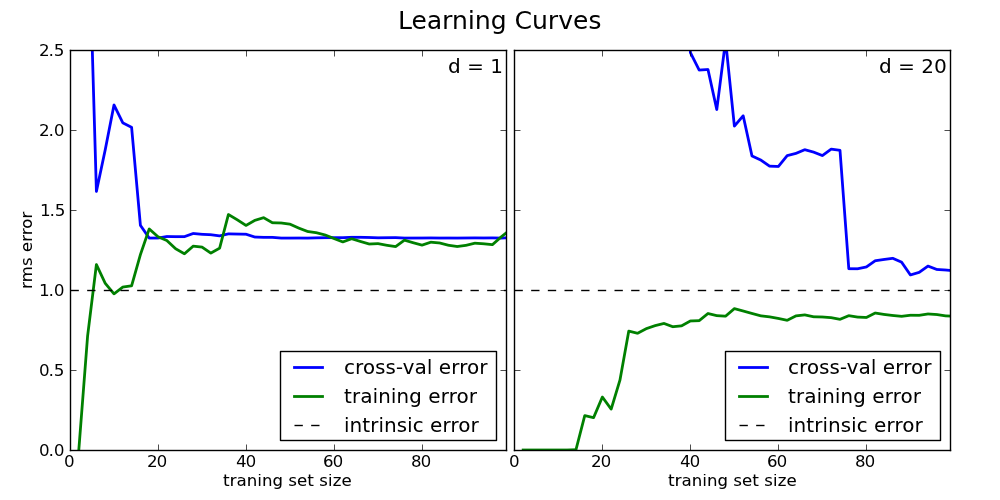
# Plot training error and cross-val error
# as a function of training set size
Ntrain = 100
Ncrossval = 100
error = 1.0
np.random.seed(0)
x = np.random.random(Ntrain + Ncrossval)
y = test_func(x, error)
xtrain = x[:Ntrain]
ytrain = y[:Ntrain]
xcrossval = x[Ntrain:]
ycrossval = y[Ntrain:]
sizes = np.linspace(2, Ntrain, 50).astype(int)
train_err = np.zeros(sizes.shape)
crossval_err = np.zeros(sizes.shape)
pl.figure(figsize=(10, 5))
for j,d in enumerate((1, 20)):
for i, size in enumerate(sizes):
p = np.polyfit(xtrain[:size], ytrain[:size], d)
crossval_err[i] = compute_error(xcrossval, ycrossval, p)
train_err[i] = compute_error(xtrain[:size], ytrain[:size], p)
ax = pl.subplot(121 + j)
pl.plot(sizes, crossval_err, lw=2, label='cross-val error')
pl.plot(sizes, train_err, lw=2, label='training error')
pl.plot([0, Ntrain], [error, error], '--k', label='intrinsic error')
pl.xlabel('traning set size')
if j == 0:
pl.ylabel('rms error')
else:
ax.yaxis.set_major_formatter(ticker.NullFormatter())
pl.legend(loc = 4)
pl.ylim(0.0, 2.5)
pl.xlim(0, 99)
pl.text(98, 2.45, 'd = %i' % d, ha='right', va='top', fontsize='large')
pl.subplots_adjust(wspace = 0.02, left=0.07, right=0.95)
pl.suptitle('Learning Curves', fontsize=18)
pl.show()