Manifold learning on handwritten digits: Locally Linear Embedding, Isomap...
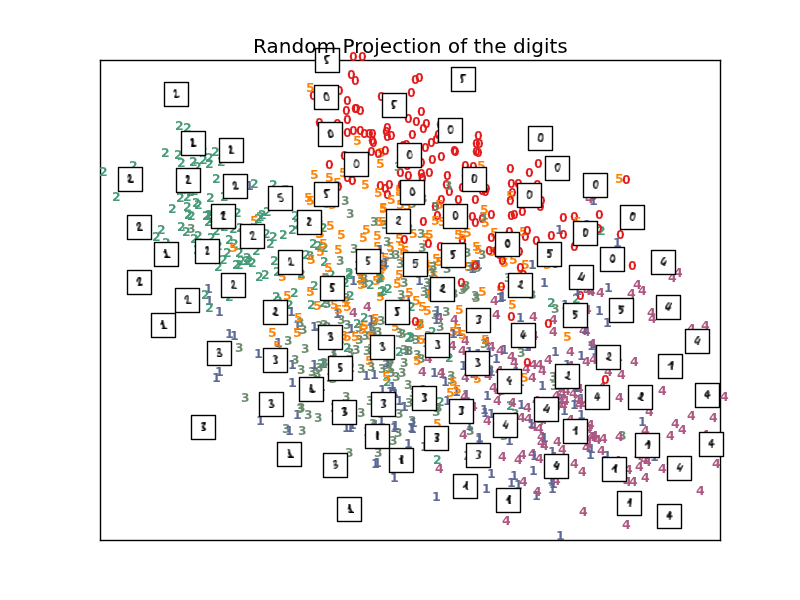
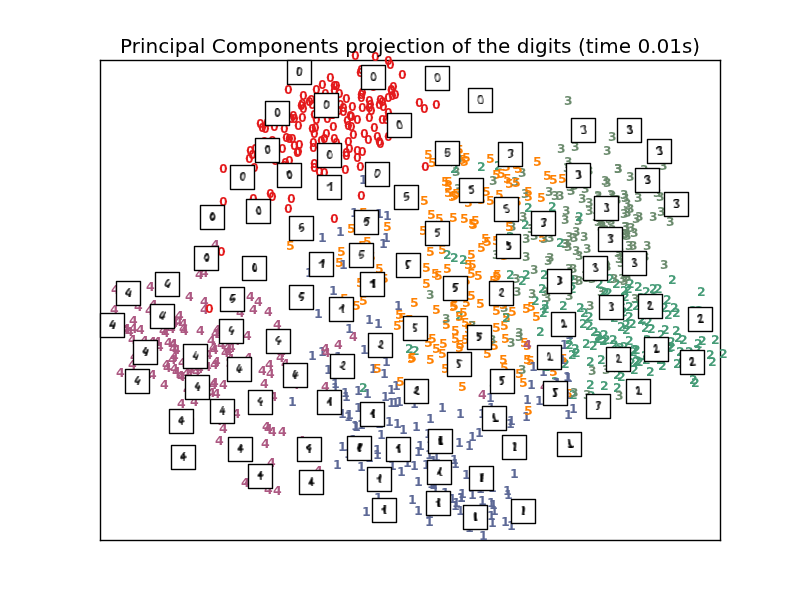
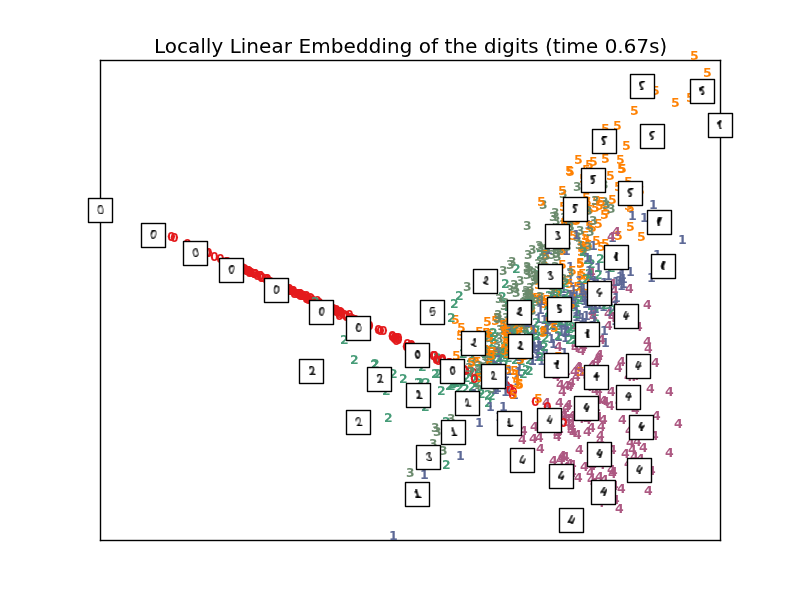
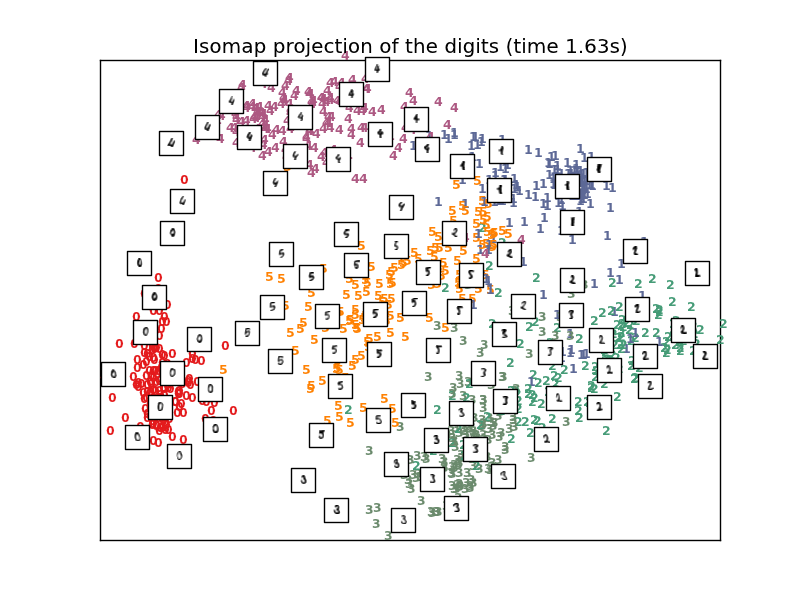
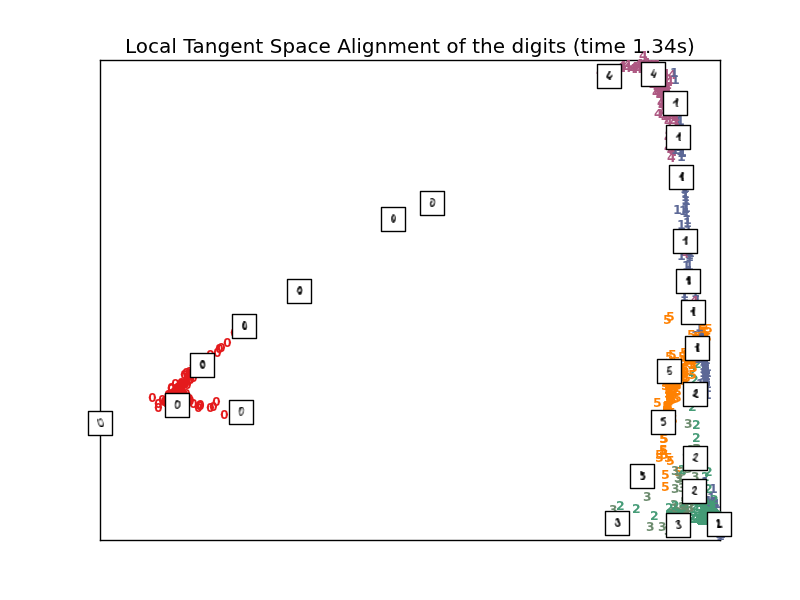
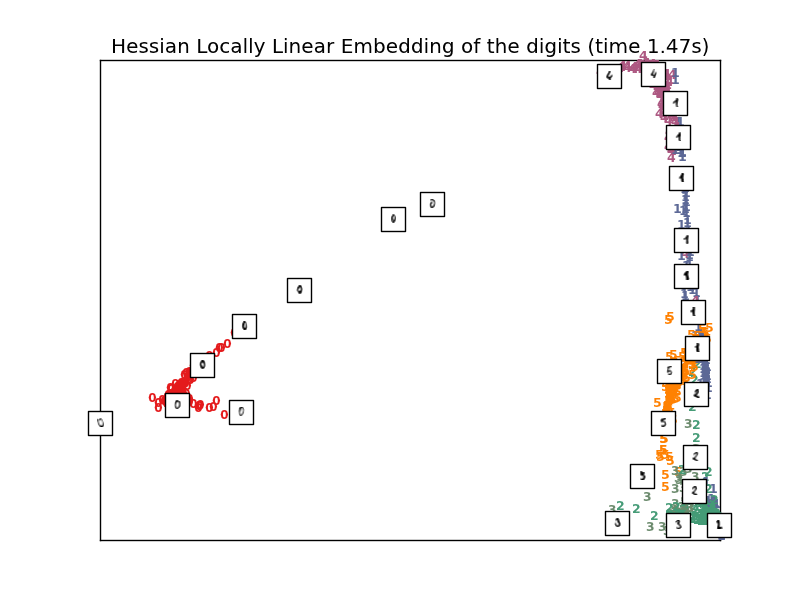
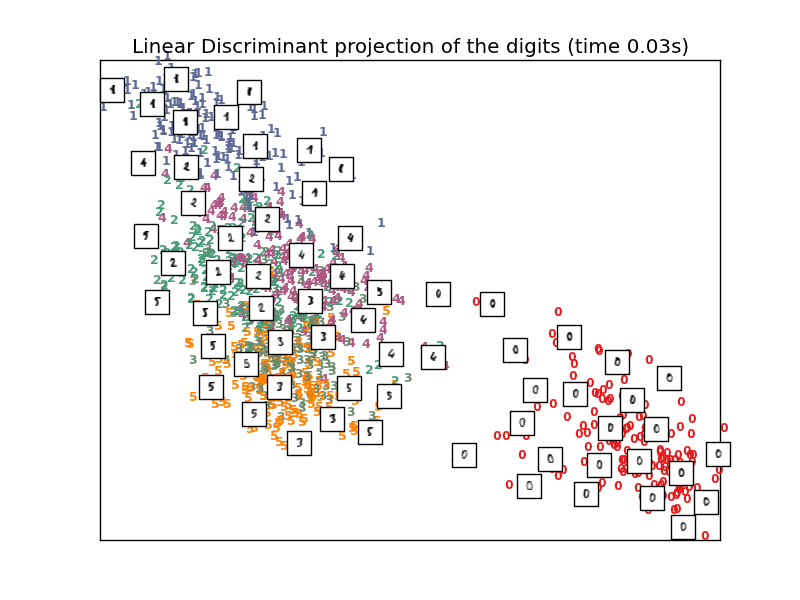
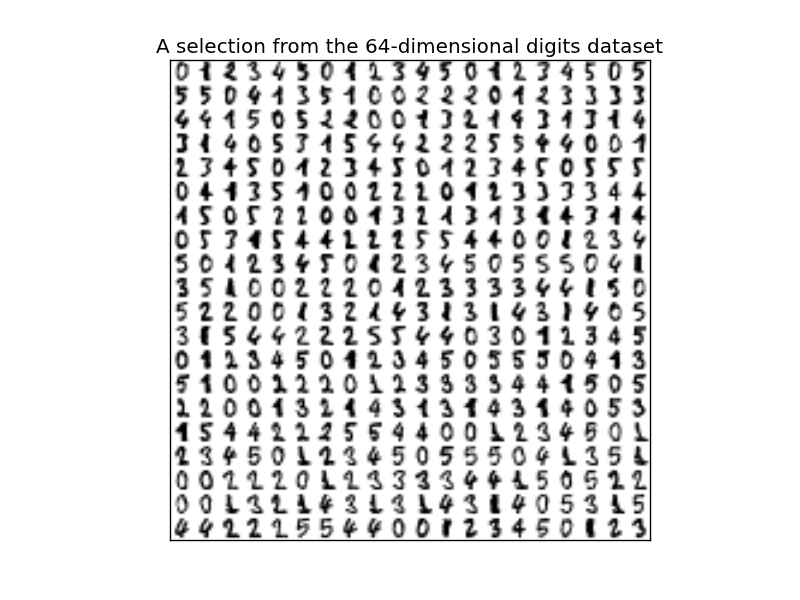
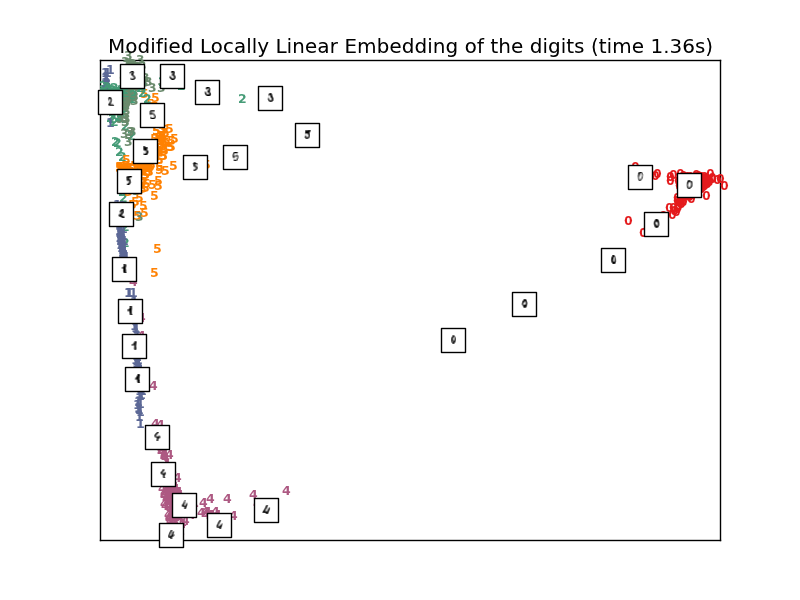
An illustration of various embeddings on the digits dataset.
Script output:
Computing random projection
Computing PCA projection
Computing LDA projection
Computing Isomap embedding
Done.
Computing LLE embedding
Done. Reconstruction error: 1.28548e-06
Computing modified LLE embedding
Done. Reconstruction error: 0.359939
Computing Hessian LLE embedding
Done. Reconstruction error: 0.212066
Computing LTSA embedding
Done. Reconstruction error: 0.212076
Python source code: plot_lle_digits.py
# Authors: Fabian Pedregosa <fabian.pedregosa@inria.fr>
#          Olivier Grisel <olivier.grisel@ensta.org>
#          Mathieu Blondel <mathieu@mblondel.org>
# License: BSD, (C) INRIA 2011

print __doc__
from time import time

import numpy as np
import pylab as pl
from matplotlib import offsetbox
from sklearn.utils.fixes import qr_economic
from sklearn import manifold, datasets, decomposition, lda

digits = datasets.load_digits(n_class=6)
X = digits.data
y = digits.target
n_samples, n_features = X.shape
n_neighbors = 30


#----------------------------------------------------------------------
# Scale and visualize the embedding vectors
def plot_embedding(X, title=None):
    x_min, x_max = np.min(X, 0), np.max(X, 0)
    X = (X - x_min) / (x_max - x_min)

    pl.figure()
    ax = pl.subplot(111)
    for i in range(digits.data.shape[0]):
        pl.text(X[i, 0], X[i, 1], str(digits.target[i]),
                color=pl.cm.Set1(digits.target[i] / 10.),
                fontdict={'weight': 'bold', 'size': 9})

    if hasattr(offsetbox, 'AnnotationBbox'):
        # only print thumbnails with matplotlib > 1.0
        shown_images = np.array([[1., 1.]])  # just something big
        for i in range(digits.data.shape[0]):
            dist = np.sum((X[i] - shown_images) ** 2, 1)
            if np.min(dist) < 4e-3:
                # don't show points that are too close
                continue
            shown_images = np.r_[shown_images, [X[i]]]
            imagebox = offsetbox.AnnotationBbox(
                offsetbox.OffsetImage(digits.images[i], cmap=pl.cm.gray_r),
                X[i])
            ax.add_artist(imagebox)
    pl.xticks([]), pl.yticks([])
    if title is not None:
        pl.title(title)


#----------------------------------------------------------------------
# Plot images of the digits
N = 20
img = np.zeros((10 * N, 10 * N))
for i in range(N):
    ix = 10 * i + 1
    for j in range(N):
        iy = 10 * j + 1
        img[ix:ix + 8, iy:iy + 8] = X[i * N + j].reshape((8, 8))
pl.imshow(img, cmap=pl.cm.binary)
pl.xticks([])
pl.yticks([])
pl.title('A selection from the 64-dimensional digits dataset')


#----------------------------------------------------------------------
# Random 2D projection using a random unitary matrix
print "Computing random projection"
rng = np.random.RandomState(42)
Q, _ = qr_economic(rng.normal(size=(n_features, 2)))
X_projected = np.dot(Q.T, X.T).T
plot_embedding(X_projected, "Random Projection of the digits")


#----------------------------------------------------------------------
# Projection on to the first 2 principal components

print "Computing PCA projection"
t0 = time()
X_pca = decomposition.RandomizedPCA(n_components=2).fit_transform(X)
plot_embedding(X_pca,
    "Principal Components projection of the digits (time %.2fs)" %
    (time() - t0))

#----------------------------------------------------------------------
# Projection on to the first 2 linear discriminant components

print "Computing LDA projection"
X2 = X.copy()
X2.flat[::X.shape[1] + 1] += 0.01  # Make X invertible
t0 = time()
X_lda = lda.LDA(n_components=2).fit_transform(X2, y)
plot_embedding(X_lda,
    "Linear Discriminant projection of the digits (time %.2fs)" %
    (time() - t0))


#----------------------------------------------------------------------
# Isomap projection of the digits dataset
print "Computing Isomap embedding"
t0 = time()
X_iso = manifold.Isomap(n_neighbors, out_dim=2).fit_transform(X)
print "Done."
plot_embedding(X_iso,
    "Isomap projection of the digits (time %.2fs)" %
    (time() - t0))


#----------------------------------------------------------------------
# Locally linear embedding of the digits dataset
print "Computing LLE embedding"
clf = manifold.LocallyLinearEmbedding(n_neighbors, out_dim=2,
                                      method='standard')
t0 = time()
X_lle = clf.fit_transform(X)
print "Done. Reconstruction error: %g" % clf.reconstruction_error_
plot_embedding(X_lle,
    "Locally Linear Embedding of the digits (time %.2fs)" %
    (time() - t0))


#----------------------------------------------------------------------
# Modified Locally linear embedding of the digits dataset
print "Computing modified LLE embedding"
clf = manifold.LocallyLinearEmbedding(n_neighbors, out_dim=2,
                                      method='modified')
t0 = time()
X_mlle = clf.fit_transform(X)
print "Done. Reconstruction error: %g" % clf.reconstruction_error_
plot_embedding(X_mlle,
    "Modified Locally Linear Embedding of the digits (time %.2fs)" %
    (time() - t0))


#----------------------------------------------------------------------
# HLLE embedding of the digits dataset
print "Computing Hessian LLE embedding"
clf = manifold.LocallyLinearEmbedding(n_neighbors, out_dim=2,
                                      method='hessian')
t0 = time()
X_hlle = clf.fit_transform(X)
print "Done. Reconstruction error: %g" % clf.reconstruction_error_
plot_embedding(X_hlle,
    "Hessian Locally Linear Embedding of the digits (time %.2fs)" %
    (time() - t0))


#----------------------------------------------------------------------
# LTSA embedding of the digits dataset
print "Computing LTSA embedding"
clf = manifold.LocallyLinearEmbedding(n_neighbors, out_dim=2,
                                      method='ltsa')
t0 = time()
X_ltsa = clf.fit_transform(X)
print "Done. Reconstruction error: %g" % clf.reconstruction_error_
plot_embedding(X_ltsa,
    "Local Tangent Space Alignment of the digits (time %.2fs)" %
    (time() - t0))

pl.show()

