Precision-Recall
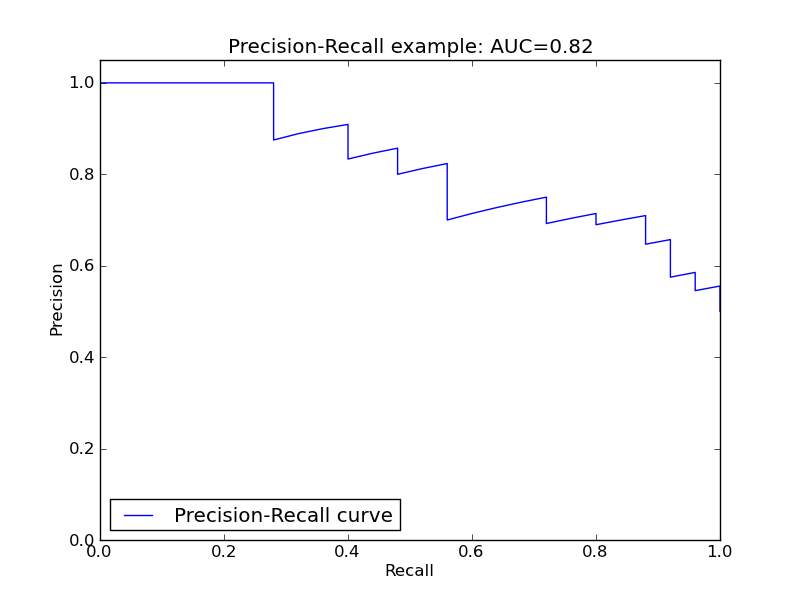
Example of Precision-Recall metric to evaluate the quality of the output of a classifier.
Python source code: plot_precision_recall.py
print __doc__

import random
import pylab as pl
import numpy as np
from scikits.learn import svm, datasets
from scikits.learn.metrics import precision_recall_curve
from scikits.learn.metrics import auc

# import some data to play with
iris = datasets.load_iris()
X = iris.data
y = iris.target
X, y = X[y!=2], y[y!=2] # Keep also 2 classes (0 and 1)
n_samples, n_features = X.shape
p = range(n_samples) # Shuffle samples
random.seed(0)
random.shuffle(p)
X, y = X[p], y[p]
half = int(n_samples/2)

# Add noisy features
np.random.seed(0)
X = np.c_[X,np.random.randn(n_samples, 200 * n_features)]

# Run classifier
classifier = svm.SVC(kernel='linear', probability=True)
probas_ = classifier.fit(X[:half], y[:half]).predict_proba(X[half:])

# Compute Precision-Recall and plot curve
precision, recall, thresholds = precision_recall_curve(y[half:], probas_[:,1])
area = auc(recall, precision)
print "Area Under Curve: %0.2f" % area

pl.figure(-1)
pl.clf()
pl.plot(recall, precision, label='Precision-Recall curve')
pl.xlabel('Recall')
pl.ylabel('Precision')
pl.ylim([0.0,1.05])
pl.xlim([0.0,1.0])
pl.title('Precision-Recall example: AUC=%0.2f' % area)
pl.legend(loc="lower left")
pl.show()