Demo of DBSCAN clustering algorithm
Finds core samples of high density and expands clusters from them.
Script output:
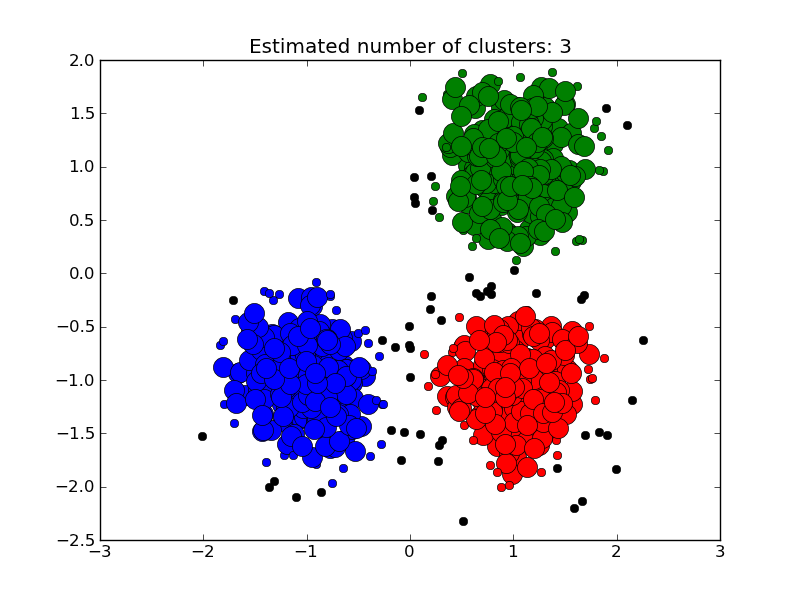
Estimated number of clusters: 3
Homogeneity: 0.942
Completeness: 0.815
V-measure: 0.874
Adjusted Rand Index: 0.900
Adjusted Mutual Information: 0.815
Silhouette Coefficient: 0.577
Python source code: plot_dbscan.py
print __doc__

import numpy as np
from scipy.spatial import distance
from sklearn.cluster import DBSCAN
from sklearn import metrics
from sklearn.datasets.samples_generator import make_blobs


##############################################################################
# Generate sample data
centers = [[1, 1], [-1, -1], [1, -1]]
X, labels_true = make_blobs(n_samples=750, centers=centers, cluster_std=0.4)

##############################################################################
# Compute similarities
D = distance.squareform(distance.pdist(X))
S = 1 - (D / np.max(D))

##############################################################################
# Compute DBSCAN
db = DBSCAN().fit(S, eps=0.95, min_samples=10)
core_samples = db.core_sample_indices_
labels = db.labels_

# Number of clusters in labels, ignoring noise if present.
n_clusters_ = len(set(labels)) - (1 if -1 in labels else 0)

print 'Estimated number of clusters: %d' % n_clusters_
print "Homogeneity: %0.3f" % metrics.homogeneity_score(labels_true, labels)
print "Completeness: %0.3f" % metrics.completeness_score(labels_true, labels)
print "V-measure: %0.3f" % metrics.v_measure_score(labels_true, labels)
print "Adjusted Rand Index: %0.3f" % \
    metrics.adjusted_rand_score(labels_true, labels)
print "Adjusted Mutual Information: %0.3f" % \
    metrics.adjusted_mutual_info_score(labels_true, labels)
print ("Silhouette Coefficient: %0.3f" %
       metrics.silhouette_score(D, labels, metric='precomputed'))

##############################################################################
# Plot result
import pylab as pl
from itertools import cycle

pl.close('all')
pl.figure(1)
pl.clf()

# Black removed and is used for noise instead.
colors = cycle('bgrcmybgrcmybgrcmybgrcmy')
for k, col in zip(set(labels), colors):
    if k == -1:
        # Black used for noise.
        col = 'k'
        markersize = 6
    class_members = [index[0] for index in np.argwhere(labels == k)]
    cluster_core_samples = [index for index in core_samples
                            if labels[index] == k]
    for index in class_members:
        x = X[index]
        if index in core_samples and k != -1:
            markersize = 14
        else:
            markersize = 6
        pl.plot(x[0], x[1], 'o', markerfacecolor=col,
                markeredgecolor='k', markersize=markersize)

pl.title('Estimated number of clusters: %d' % n_clusters_)
pl.show()