Feature importances with forests of trees
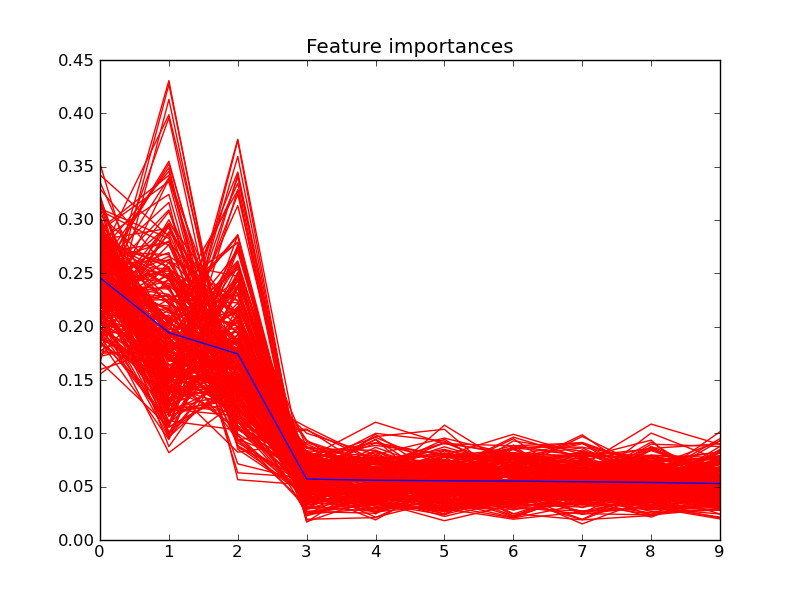
This examples shows the use of forests of trees to evaluate the importance of features on an artifical classification task. The red plots are the feature importances of each individual tree, and the blue plot is the feature importance of the whole forest.
As expected, the knee in the blue plot suggests that 3 features are informative, while the remaining are not.
Script output:
Feature ranking:
1. feature 1 (0.245865)
2. feature 0 (0.194416)
3. feature 2 (0.174455)
4. feature 7 (0.057138)
5. feature 8 (0.055967)
6. feature 4 (0.055516)
7. feature 5 (0.055179)
8. feature 9 (0.054639)
9. feature 3 (0.053921)
10. feature 6 (0.052904)
Python source code: plot_forest_importances.py
print __doc__

import numpy as np

from sklearn.datasets import make_classification
from sklearn.ensemble import ExtraTreesClassifier

# Build a classification task using 3 informative features
X, y = make_classification(n_samples=1000,
                           n_features=10,
                           n_informative=3,
                           n_redundant=0,
                           n_repeated=0,
                           n_classes=2,
                           random_state=0,
                           shuffle=False)

# Build a forest and compute the feature importances
forest = ExtraTreesClassifier(n_estimators=250,
                              compute_importances=True,
                              random_state=0)

forest.fit(X, y)
importances = forest.feature_importances_
indices = np.argsort(importances)[::-1]

# Print the feature ranking
print "Feature ranking:"

for f in xrange(10):
    print "%d. feature %d (%f)" % (f + 1, indices[f], importances[indices[f]])

# Plot the feature importances of the trees and of the forest
import pylab as pl
pl.figure()
pl.title("Feature importances")

for tree in forest.estimators_:
    pl.plot(xrange(10), tree.feature_importances_[indices], "r")

pl.plot(xrange(10), importances[indices], "b")
pl.show()