Plot the decision surfaces of ensembles of trees on the iris dataset
Plot the decision surfaces of forests of randomized trees trained on pairs of features of the iris dataset.
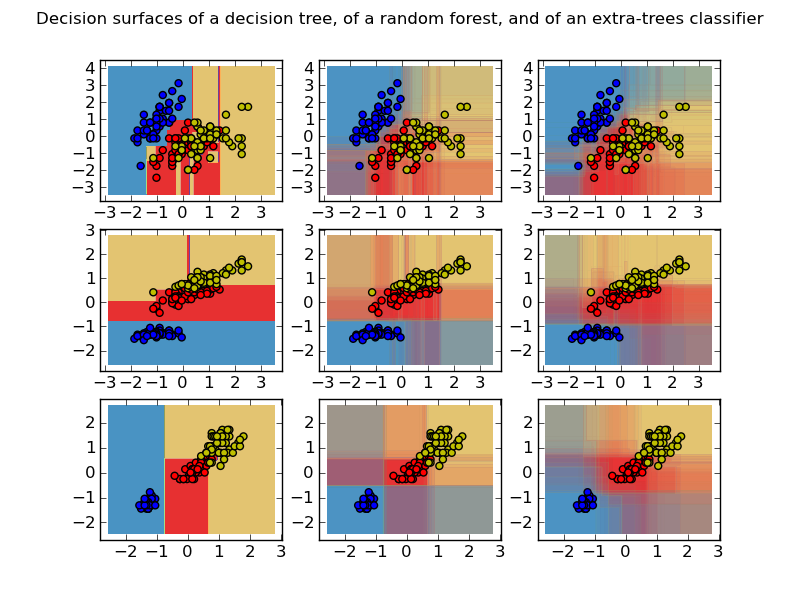
This plot compares the decision surfaces learned by a decision tree classifier (first column), by a random forest classifier (second column) and by an extra- trees classifier (third column).
In the first row, the classifiers are built using the sepal width and the sepal length features only, on the second row using the petal length and sepal length only, and on the third row using the petal width and the petal length only.
Python source code: plot_forest_iris.py
print __doc__

import numpy as np
import pylab as pl

from sklearn import clone
from sklearn.datasets import load_iris
from sklearn.ensemble import RandomForestClassifier, ExtraTreesClassifier
from sklearn.tree import DecisionTreeClassifier

# Parameters
n_classes = 3
n_estimators = 30
plot_colors = "bry"
plot_step = 0.02
pl.set_cmap(pl.cm.Paired)

# Load data
iris = load_iris()

plot_idx = 1

for pair in ([0, 1], [0, 2], [2, 3]):
    for model in (DecisionTreeClassifier(),
                  RandomForestClassifier(n_estimators=n_estimators),
                  ExtraTreesClassifier(n_estimators=n_estimators)):
         # We only take the two corresponding features
        X = iris.data[:, pair]
        y = iris.target

        # Shuffle
        idx = np.arange(X.shape[0])
        np.random.seed(13)
        np.random.shuffle(idx)
        X = X[idx]
        y = y[idx]

        # Standardize
        mean = X.mean(axis=0)
        std = X.std(axis=0)
        X = (X - mean) / std

        # Train
        clf = clone(model)
        clf = model.fit(X, y)

        # Plot the decision boundary
        pl.subplot(3, 3, plot_idx)

        x_min, x_max = X[:, 0].min() - 1, X[:, 0].max() + 1
        y_min, y_max = X[:, 1].min() - 1, X[:, 1].max() + 1
        xx, yy = np.meshgrid(np.arange(x_min, x_max, plot_step),
                             np.arange(y_min, y_max, plot_step))

        if isinstance(model, DecisionTreeClassifier):
            Z = model.predict(np.c_[xx.ravel(), yy.ravel()])
            Z = Z.reshape(xx.shape)
            cs = pl.contourf(xx, yy, Z)
        else:
            for tree in model.estimators_:
                Z = tree.predict(np.c_[xx.ravel(), yy.ravel()])
                Z = Z.reshape(xx.shape)
                cs = pl.contourf(xx, yy, Z, alpha=0.1)

        #pl.xlabel("%s / %s" % (iris.feature_names[pair[0]],
        #                       model.__class__.__name__))
        #pl.ylabel(iris.feature_names[pair[1]])
        pl.axis("tight")

        # Plot the training points
        for i, c in zip(xrange(n_classes), plot_colors):
            idx = np.where(y == i)
            pl.scatter(X[idx, 0], X[idx, 1], c=c, label=iris.target_names[i])

        pl.axis("tight")

        plot_idx += 1

pl.suptitle("Decision surfaces of a decision tree, of a random forest, and of "
            "an extra-trees classifier")
pl.show()