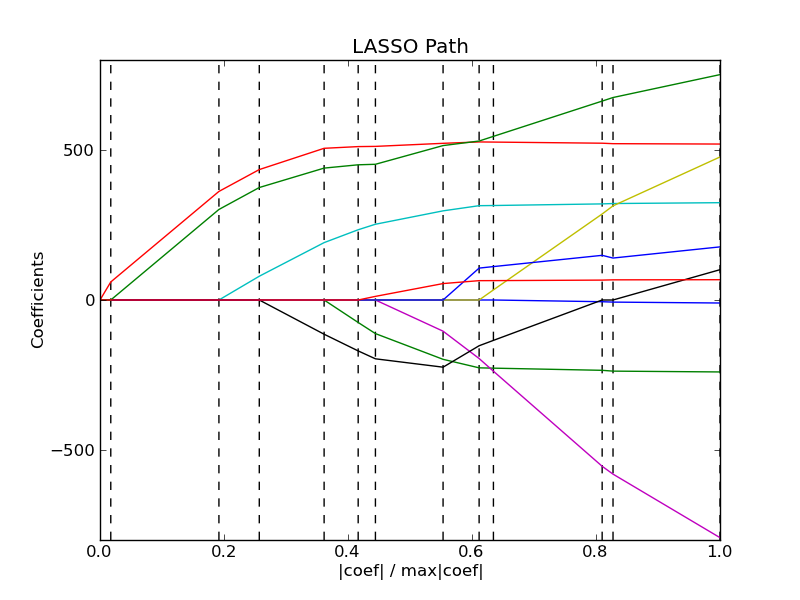
Lasso path using LARS
Computes Lasso Path along the regularization parameter using the LARS algorithm on the diabetest dataset.
Script output:
Computing regularization path using the LARS ...
Step          Added           Dropped         Active set size         C
0             2                               1               949.435260384
1             8                               2               889.315990735
2             3                               3               452.900968908
3             6                               4               316.074052698
4             1                               5               130.130851302
5             9                               6               88.7824298155
6             4                               7               68.9652212024
7             7                               8               19.9812546781
8             5                               9               5.47747294605
9             0                               10              5.0891788056
10                            6               9               2.18224972883
11            6                               10              1.31043524851
Python source code: plot_lasso_lars.py
print __doc__

# Author: Fabian Pedregosa <fabian.pedregosa@inria.fr>
#         Alexandre Gramfort <alexandre.gramfort@inria.fr>
# License: BSD Style.

import numpy as np
import pylab as pl

from sklearn import linear_model
from sklearn import datasets

diabetes = datasets.load_diabetes()
X = diabetes.data
y = diabetes.target

print "Computing regularization path using the LARS ..."
alphas, _, coefs = linear_model.lars_path(X, y, method='lasso', verbose=True)

xx = np.sum(np.abs(coefs.T), axis=1)
xx /= xx[-1]

pl.plot(xx, coefs.T)
ymin, ymax = pl.ylim()
pl.vlines(xx, ymin, ymax, linestyle='dashed')
pl.xlabel('|coef| / max|coef|')
pl.ylabel('Coefficients')
pl.title('LASSO Path')
pl.axis('tight')
pl.show()