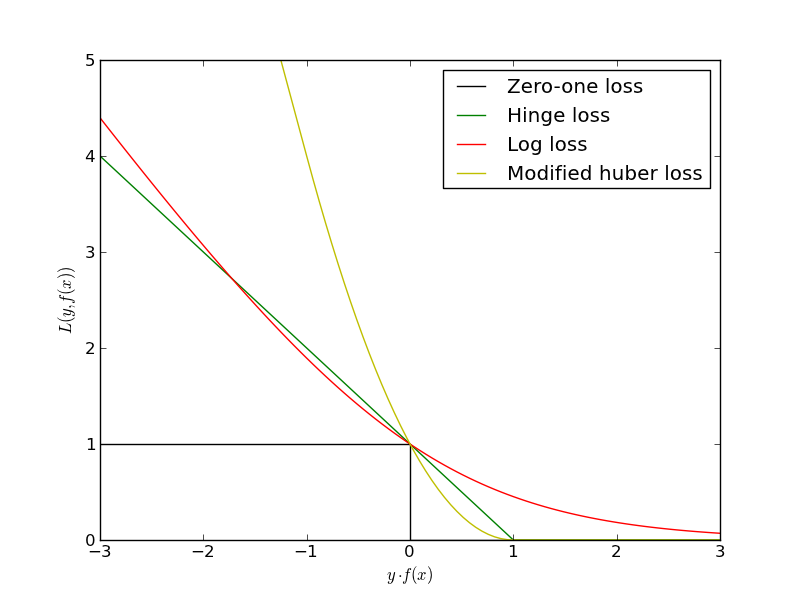
SGD: Convex Loss Functions
Plot the convex loss functions supported by sklearn.linear_model.stochastic_gradient.
Python source code: plot_sgd_loss_functions.py
print __doc__

import numpy as np
import pylab as pl
from sklearn.linear_model.sgd_fast import Hinge, \
     ModifiedHuber, SquaredLoss

###############################################################################
# Define loss funcitons
xmin, xmax = -3, 3
hinge = Hinge(1)
log_loss = lambda z, p: np.log2(1.0 + np.exp(-z))
modified_huber = ModifiedHuber()
squared_loss = SquaredLoss()

###############################################################################
# Plot loss funcitons
xx = np.linspace(xmin, xmax, 100)
pl.plot([xmin, 0, 0, xmax], [1, 1, 0, 0], 'k-',
        label="Zero-one loss")
pl.plot(xx, [hinge.loss(x, 1) for x in xx], 'g-',
        label="Hinge loss")
pl.plot(xx, [log_loss(x, 1) for x in xx], 'r-',
        label="Log loss")
pl.plot(xx, [modified_huber.loss(x, 1) for x in xx], 'y-',
        label="Modified huber loss")
#pl.plot(xx, [2.0*squared_loss.loss(x, 1) for x in xx], 'c-',
#        label="Squared loss")
pl.ylim((0, 5))
pl.legend(loc="upper right")
pl.xlabel(r"$y \cdot f(x)$")
pl.ylabel("$L(y, f(x))$")
pl.show()