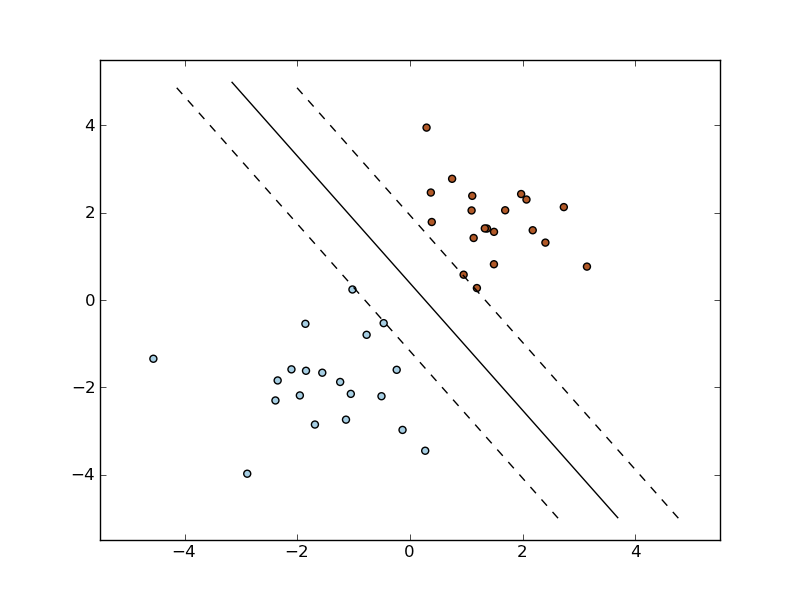
SGD: Maximum margin separating hyperplane
Plot the maximum margin separating hyperplane within a two-class separable dataset using a linear Support Vector Machines classifier trained using SGD.
Python source code: plot_sgd_separating_hyperplane.py
print __doc__

import numpy as np
import pylab as pl
from sklearn.linear_model import SGDClassifier

# we create 40 separable points
np.random.seed(0)
X = np.r_[np.random.randn(20, 2) - [2, 2], np.random.randn(20, 2) + [2, 2]]
Y = [0] * 20 + [1] * 20

# fit the model
clf = SGDClassifier(loss="hinge", alpha=0.01, n_iter=50, fit_intercept=True)
clf.fit(X, Y)

# plot the line, the points, and the nearest vectors to the plane
xx = np.linspace(-5, 5, 10)
yy = np.linspace(-5, 5, 10)
X1, X2 = np.meshgrid(xx, yy)
Z = np.empty(X1.shape)
for (i, j), val in np.ndenumerate(X1):
    x1 = val
    x2 = X2[i, j]
    p = clf.decision_function([x1, x2])
    Z[i, j] = p[0]
levels = [-1.0, 0.0, 1.0]
linestyles = ['dashed', 'solid', 'dashed']
colors = 'k'
pl.set_cmap(pl.cm.Paired)
pl.contour(X1, X2, Z, levels, colors=colors, linestyles=linestyles)
pl.scatter(X[:, 0], X[:, 1], c=Y)

pl.axis('tight')
pl.show()