RBF SVM parameters
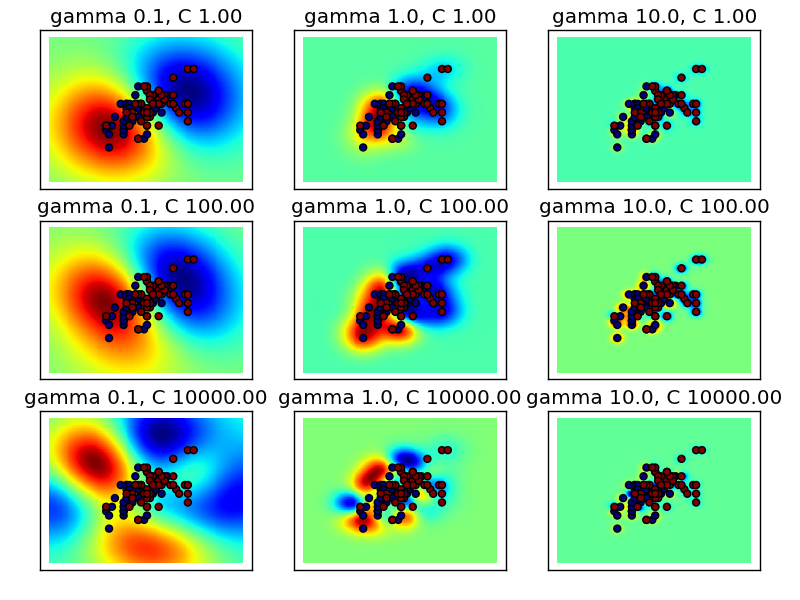
This example illustrates the effect of the parameters gamma and C of the rbf kernel SVM.
Intuitively, the gamma parameter defines how far the influence of a single training example reaches, with low values meaning ‘far’ and high values meaning ‘close’. The C parameter trades off misclassification of training examples against simplicity of the decision surface. A low C makes the decision surface smooth, while a high C aims at classifying all training examples correctly.
Python source code: plot_rbf_parameters.py
print __doc__

import numpy as np
import pylab as pl

from sklearn import svm
from sklearn.datasets import load_iris
from sklearn.preprocessing import Scaler

iris = load_iris()
X = iris.data[:, :2]  # Take only 2 dimensions
y = iris.target
X = X[y > 0]
y = y[y > 0]
y -= 1

scaler = Scaler()
X = scaler.fit_transform(X)

xx, yy = np.meshgrid(np.linspace(-5, 5, 200), np.linspace(-5, 5, 200))

np.random.seed(0)

gamma_range = [1e-1, 1, 1e1]
C_range = [1, 1e2, 1e4]

pl.figure()
k = 1

for C in C_range:
    for gamma in gamma_range:
        # fit the model
        clf = svm.SVC(gamma=gamma, C=C)
        clf.fit(X, y)

        # plot the decision function for each datapoint on the grid
        Z = clf.decision_function(np.c_[xx.ravel(), yy.ravel()])
        Z = Z.reshape(xx.shape)

        pl.subplot(3, 3, k)
        pl.title("gamma %.1f, C %.2f" % (gamma, C))
        k += 1
        pl.pcolormesh(xx, yy, -Z, cmap=pl.cm.jet)
        pl.scatter(X[:, 0], X[:, 1], c=y, cmap=pl.cm.jet)
        pl.xticks(())
        pl.yticks(())
        pl.axis('tight')

pl.subplots_adjust(left=0.05, right=0.95, bottom=0.05, top=0.95)
pl.show()