Script output:
[0.10000000000000001, 0.10000000000000001, 0.10000000000000001]
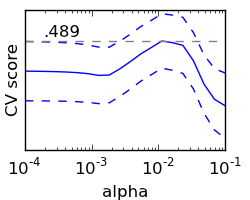
Python source code: plot_cv_diabetes.py
import pylab as pl

from scikits.learn import cross_val, datasets, linear_model

diabetes = datasets.load_diabetes()
X = diabetes.data
y = diabetes.target

lasso = linear_model.Lasso()

alphas = np.logspace(-4, -1, 20)

scores = list()
scores_std = list()

for alpha in alphas:
    lasso.alpha = alpha
    this_scores = cross_val.cross_val_score(lasso, X, y, n_jobs=-1)
    scores.append(np.mean(this_scores))
    scores_std.append(np.std(this_scores))

pl.figure(1, figsize=(2.5, 2))
pl.clf()
pl.axes([.1, .25, .8, .7])
pl.semilogx(alphas, scores)
pl.semilogx(alphas, np.array(scores) + np.array(scores_std)/20, 'b--')
pl.semilogx(alphas, np.array(scores) - np.array(scores_std)/20, 'b--')
pl.yticks(())
pl.ylabel('CV score')
pl.xlabel('alpha')
pl.axhline(np.max(scores), linestyle='--', color='.5')
pl.text(2e-4, np.max(scores)+1e-4, '.489')

################################################################################
# Bonus: how much can you trust the selection of alpha?
from scikits.learn import cross_val
k_fold = cross_val.KFold(len(X), 3)
print [lasso.fit(X[train], y[train]).alpha for train, _ in k_fold]