Python source code: plot_digits_pipe.py
import pylab as pl
from scikits.learn import linear_model, decomposition, datasets, cross_val
logistic = linear_model.LogisticRegression()
pca = decomposition.PCA()
from scikits.learn.pipeline import Pipeline
pipe = Pipeline(steps=[('pca', pca), ('logistic', logistic)])
digits = datasets.load_digits()
X_digits = digits.data
y_digits = digits.target
################################################################################
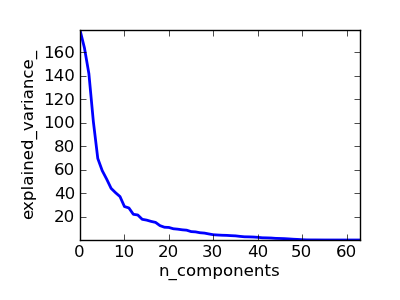
# Plot the PCA spectrum
pca.fit(X_digits)
pl.figure(1, figsize=(4, 3))
pl.clf()
pl.axes([.2, .2, .7, .7])
pl.plot(pca.explained_variance_, linewidth=2)
pl.axis('tight')
pl.xlabel('n_components')
pl.ylabel('explained_variance_')
################################################################################
# Prediction
scores = cross_val.cross_val_score(pipe, X_digits, y_digits, n_jobs=-1)
from scikits.learn.grid_search import GridSearchCV
n_components = [10, 15, 20, 30, 40, 50, 64]
Cs = np.logspace(-4, 4, 16)
estimator = GridSearchCV(pipe,
dict(pca__n_components=n_components,
logistic__C=Cs),
n_jobs=-1)
estimator.fit(X_digits, y_digits)