Python source code: plot_gui_example.py
import pylab as pl
import matplotlib
from sklearn import svm
def linear_model(rseed=42, Npts=30):
np.random.seed(rseed)
data = np.random.normal(0, 10, (Npts, 2))
data[:Npts / 2] -= 15
data[Npts / 2:] += 15
labels = np.ones(Npts)
labels[:Npts / 2] = -1
return data, labels
def nonlinear_model(rseed=42, Npts=30):
radius = 40 * np.random.random(Npts)
far_pts = radius > 20
radius[far_pts] *= 1.2
radius[~far_pts] *= 1.1
theta = np.random.random(Npts) * np.pi * 2
data = np.empty((Npts, 2))
data[:, 0] = radius * np.cos(theta)
data[:, 1] = radius * np.sin(theta)
labels = np.ones(Npts)
labels[far_pts] = -1
return data, labels
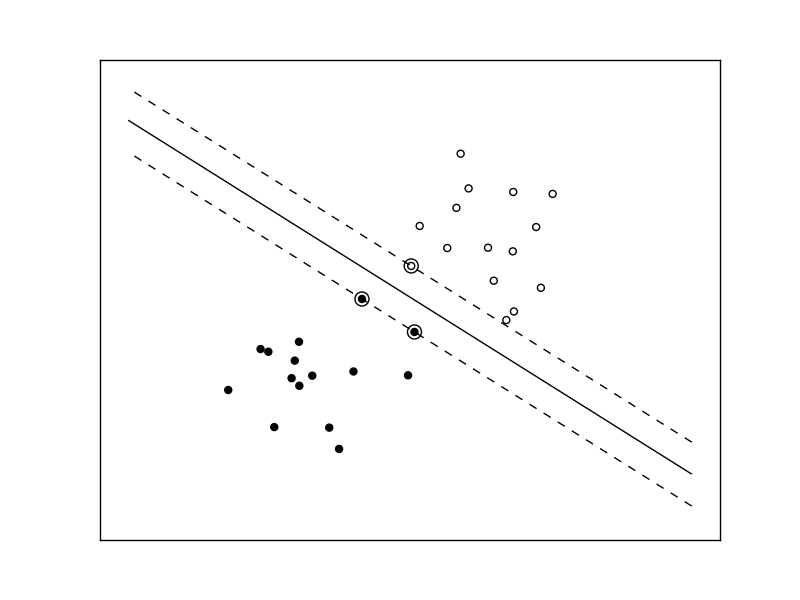
#------------------------------------------------------------
# Linear model
X, y = linear_model()
clf = svm.SVC(kernel='linear',
gamma=0.01, coef0=0, degree=3)
clf.fit(X, y)
fig = pl.figure()
ax = pl.subplot(111, xticks=[], yticks=[])
ax.scatter(X[:, 0], X[:, 1], c=y, cmap=pl.cm.bone)
ax.scatter(clf.support_vectors_[:, 0],
clf.support_vectors_[:, 1],
s=80, edgecolors="k", facecolors="none")
delta = 1
y_min, y_max = -50, 50
x_min, x_max = -50, 50
x = np.arange(x_min, x_max + delta, delta)
y = np.arange(y_min, y_max + delta, delta)
X1, X2 = np.meshgrid(x, y)
Z = clf.decision_function(np.c_[X1.ravel(), X2.ravel()])
Z = Z.reshape(X1.shape)
levels = [-1.0, 0.0, 1.0]
linestyles = ['dashed', 'solid', 'dashed']
colors = 'k'
ax.contour(X1, X2, Z, levels,
colors=colors,
linestyles=linestyles)
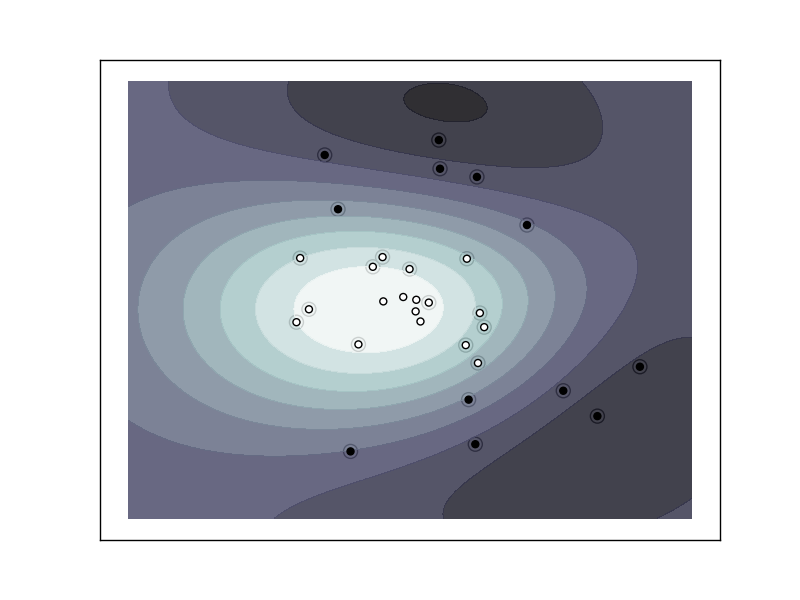
#------------------------------------------------------------
# RBF model
X, y = nonlinear_model()
clf = svm.SVC(kernel='rbf',
gamma=0.001, coef0=0, degree=3)
clf.fit(X, y)
fig = pl.figure()
ax = pl.subplot(111, xticks=[], yticks=[])
ax.scatter(X[:, 0], X[:, 1], c=y, cmap=pl.cm.bone, zorder=2)
ax.scatter(clf.support_vectors_[:, 0],
clf.support_vectors_[:, 1],
s=80, edgecolors="k", facecolors="none")
delta = 1
y_min, y_max = -50, 50
x_min, x_max = -50, 50
x = np.arange(x_min, x_max + delta, delta)
y = np.arange(y_min, y_max + delta, delta)
X1, X2 = np.meshgrid(x, y)
Z = clf.decision_function(np.c_[X1.ravel(), X2.ravel()])
Z = Z.reshape(X1.shape)
levels = [-1.0, 0.0, 1.0]
linestyles = ['dashed', 'solid', 'dashed']
colors = 'k'
ax.contourf(X1, X2, Z, 10,
cmap=matplotlib.cm.bone,
origin='lower',
alpha=0.85, zorder=1)
ax.contour(X1, X2, Z, [0.0],
colors='k',
linestyles=['solid'], zorder=1)
pl.show()