Python source code: plot_iris_dataset.py
from sklearn import datasets
# import some data to play with
iris = datasets.load_iris()
X = iris.data[:, :2] # we only take the first two features.
Y = iris.target
# Keep only classes one and two
X = X[Y > 0]
Y = Y[Y > 0]
x_min, x_max = X[:,0].min() - .5, X[:,0].max() + .5
y_min, y_max = X[:,1].min() - .5, X[:,1].max() + .5
pl.figure(1, figsize=(4, 3))
pl.clf()
pl.set_cmap(pl.cm.Paired)
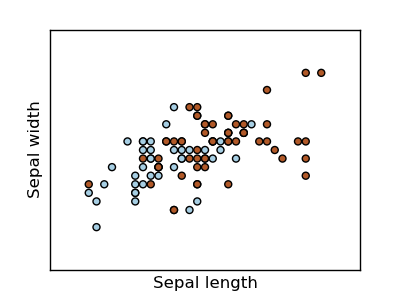
# Plot also the training points
pl.scatter(X[:,0], X[:,1], c=Y)
pl.xlabel('Sepal length')
pl.ylabel('Sepal width')
pl.xlim(x_min, x_max)
pl.ylim(y_min, y_max)
pl.xticks(())
pl.yticks(())