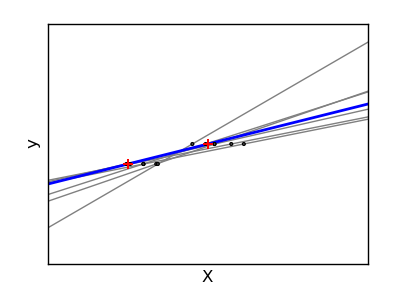
Linear Regression Variance Example
Due to the few points in each dimension and the straight line that linear regression uses follows these points as well as it can, noise on the observations will cause great variace as shown in this plot. Every line’s slope can vary quite a bit for each prediction due to the noise induced in the observations.
Python source code: plot_ols_variance.py
print __doc__


# Code source: Gael Varoqueux
# Modified for Documentation merge by Jaques Grobler
# License: BSD


import numpy as np
import pylab as pl

from sklearn import linear_model

X_train = np.c_[ .5, 1].T
y_train = [.5, 1]
X_test = np.c_[ 0, 2].T

fig = pl.figure(1, figsize=(4, 3))
pl.clf()
ax = pl.axes([.12, .12, .8, .8])

np.random.seed(0)
ols = linear_model.LinearRegression()

for _ in range(6):
    this_X = .1*np.random.normal(size=(2, 1)) + X_train
    ols.fit(this_X, y_train)

    ax.plot(X_test, ols.predict(X_test), color='.5')
    ax.scatter(this_X, y_train, s=3, c='.5', marker='o', zorder=10)

ols.fit(X_train, y_train)

ax.plot(X_test, ols.predict(X_test), linewidth=2, color='blue')
ax.scatter(X_train, y_train, s=30, c='r', marker='+', zorder=10)

ax.set_xticks(())
ax.set_yticks(())
ax.set_xlabel('X')
ax.set_ylabel('y')
ax.set_xlim(0, 2)

pl.show()