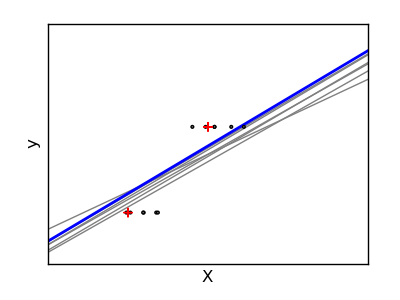
Ridge Regression Variance Example
Ridge regression is basically minimizing a penalised version of the least-squared function. The penalising shrinks the value of the regression coefficients. Despite the few data points in each dimension, the slope of the prediction is much more stable and the variance in the line itself is greatly reduced, in comparison to that of the standard linear regression
Python source code: plot_ridge_variance.py
print __doc__


# Code source: Gael Varoqueux
# Modified for Documentation merge by Jaques Grobler
# License: BSD


import numpy as np
import pylab as pl

from sklearn import linear_model

X_train = np.c_[ .5, 1].T
y_train = [.5, 1]
X_test = np.c_[ 0, 2].T

fig = pl.figure(1, figsize=(4, 3))
pl.clf()
ax = pl.axes([.12, .12, .8, .8])

np.random.seed(0)
ridge = linear_model.Ridge(alpha=.1)

for _ in range(6):
    this_X = .1*np.random.normal(size=(2, 1)) + X_train
    ridge.fit(this_X, y_train)

    ax.plot(X_test, ridge.predict(X_test), color='.5')
    ax.scatter(this_X, y_train, s=3, c='.5', marker='o', zorder=10)

ridge.fit(X_train, y_train)

ax.plot(X_test, ridge.predict(X_test), linewidth=2, color='blue')
ax.scatter(X_train, y_train, s=30, c='r', marker='+', zorder=10)

ax.set_xticks(())
ax.set_yticks(())
ax.set_xlabel('X')
ax.set_ylabel('y')
ax.set_xlim(0, 2)

pl.show()