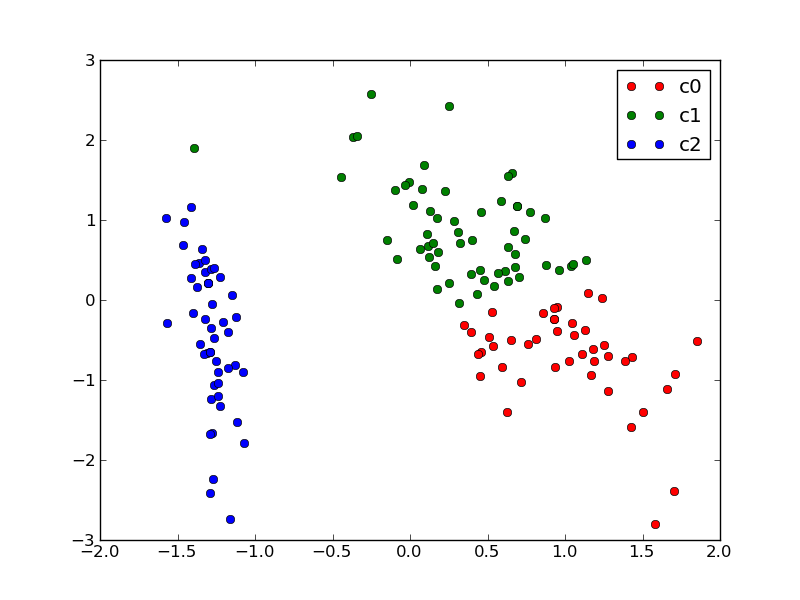
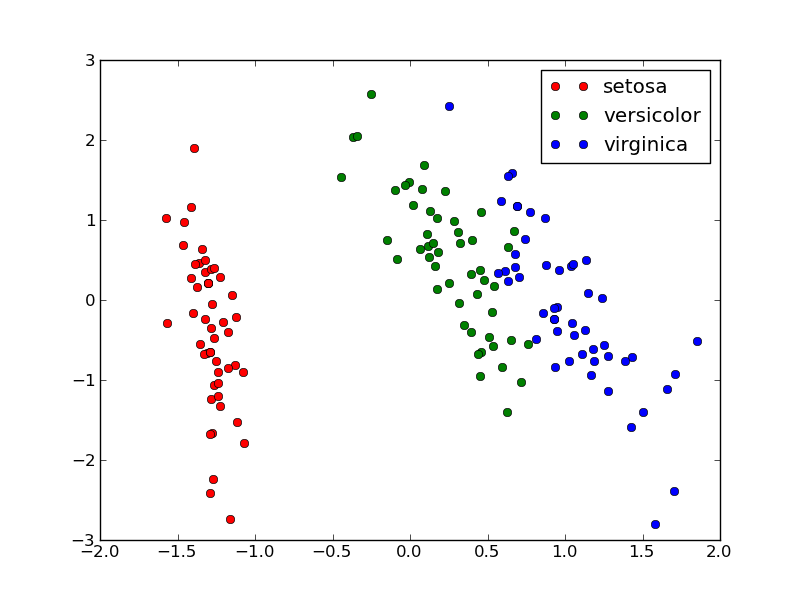
This code generates the example plots found in the tutorial
Python source code: plot_iris_projections.py
from itertools import cycle
import pylab as pl

from sklearn.datasets import load_iris
from sklearn.decomposition import PCA


def plot_2D(data, target, target_names):
    colors = cycle('rgbcmykw')
    target_ids = range(len(target_names))
    pl.figure()
    for i, c, label in zip(target_ids, colors, target_names):
        pl.plot(data[target == i, 0],
                data[target == i, 1], 'o',
                c=c, label=label)
    pl.legend(target_names)

#----------------------------------------------------------------------
# Load iris data
iris = load_iris()
X, y = iris.data, iris.target


#----------------------------------------------------------------------
# First figure: PCA
pca = PCA(n_components=2, whiten=True).fit(X)
X_pca = pca.transform(X)
plot_2D(X_pca, iris.target, iris.target_names)


#----------------------------------------------------------------------
# Second figure: Kmeans labels
from sklearn.cluster import KMeans
from numpy.random import RandomState
rng = RandomState(42)
kmeans = KMeans(3, random_state=rng).fit(X_pca)
plot_2D(X_pca, kmeans.labels_, ["c0", "c1", "c2"])


pl.show()


